One of the first math units that we cover in first grade is data analysis. Data analysis for the primary grades simply means introducing simple charts and graphs and making sure that our little learners know how to collect, sort, and organize information.
- Teach how to collect data
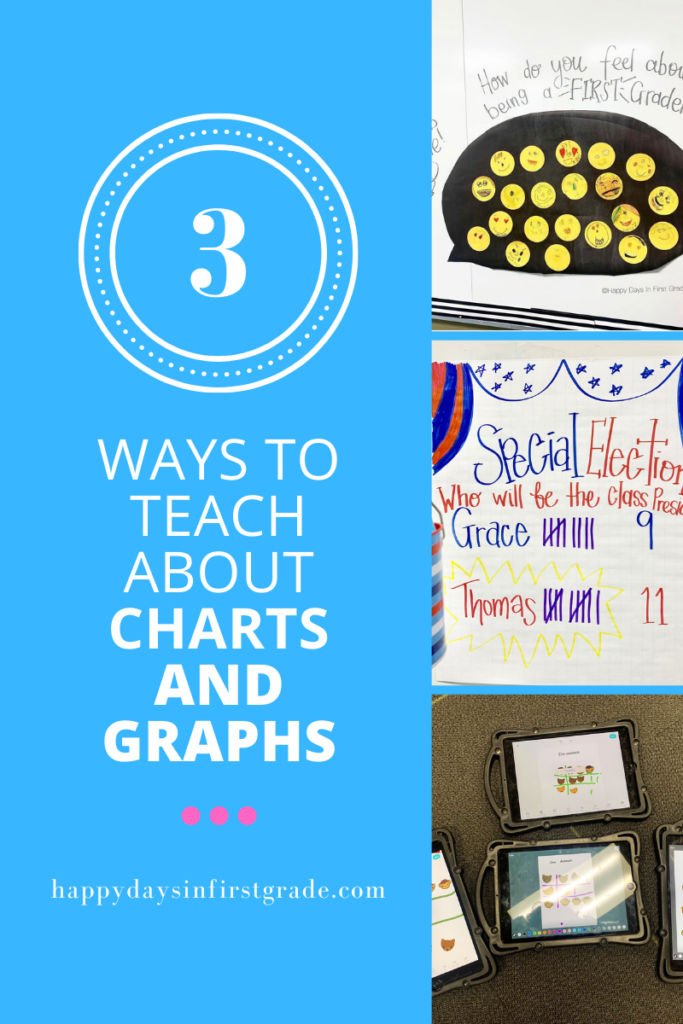
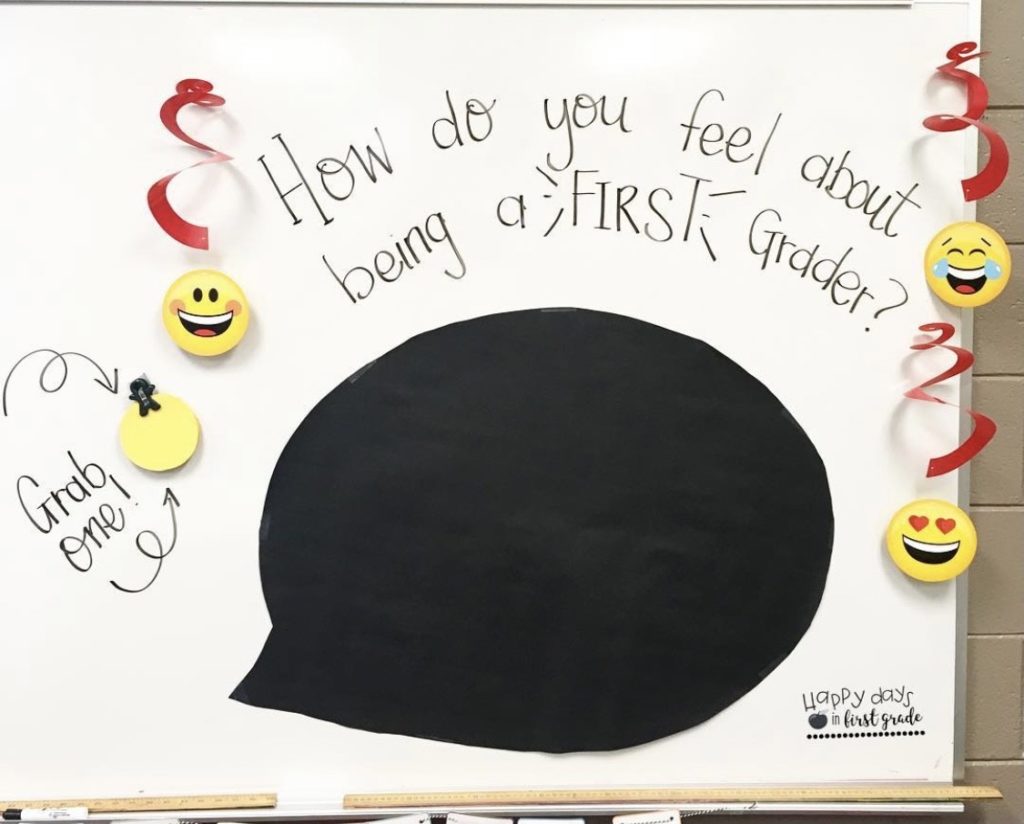
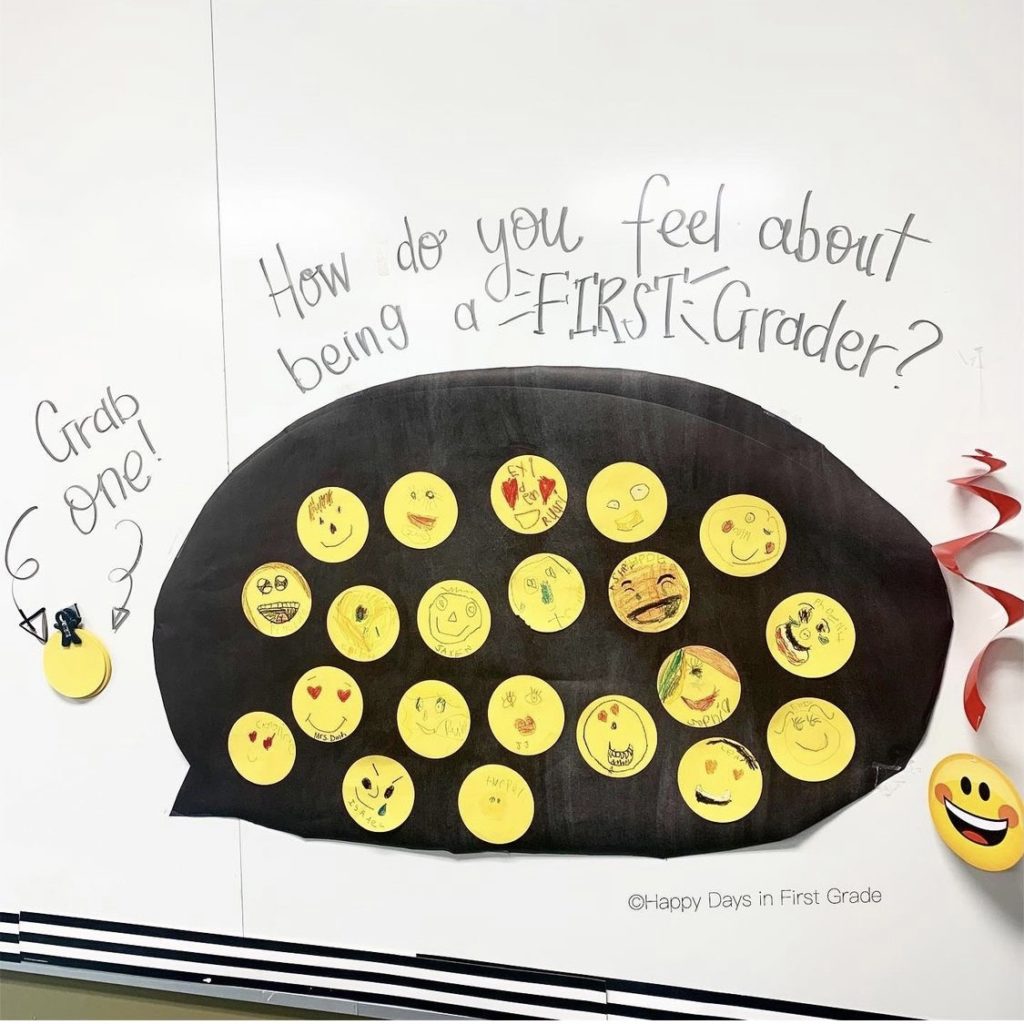
To go along with our First Days of School activities, I made circle cutouts for the kids to draw an emoji to show me how they feel. I explain that this is a way of collecting data and that we would use their emojis later to make a chart, tally chart, pictograph, and bar graph
2. Integrate with reading and take a vote!
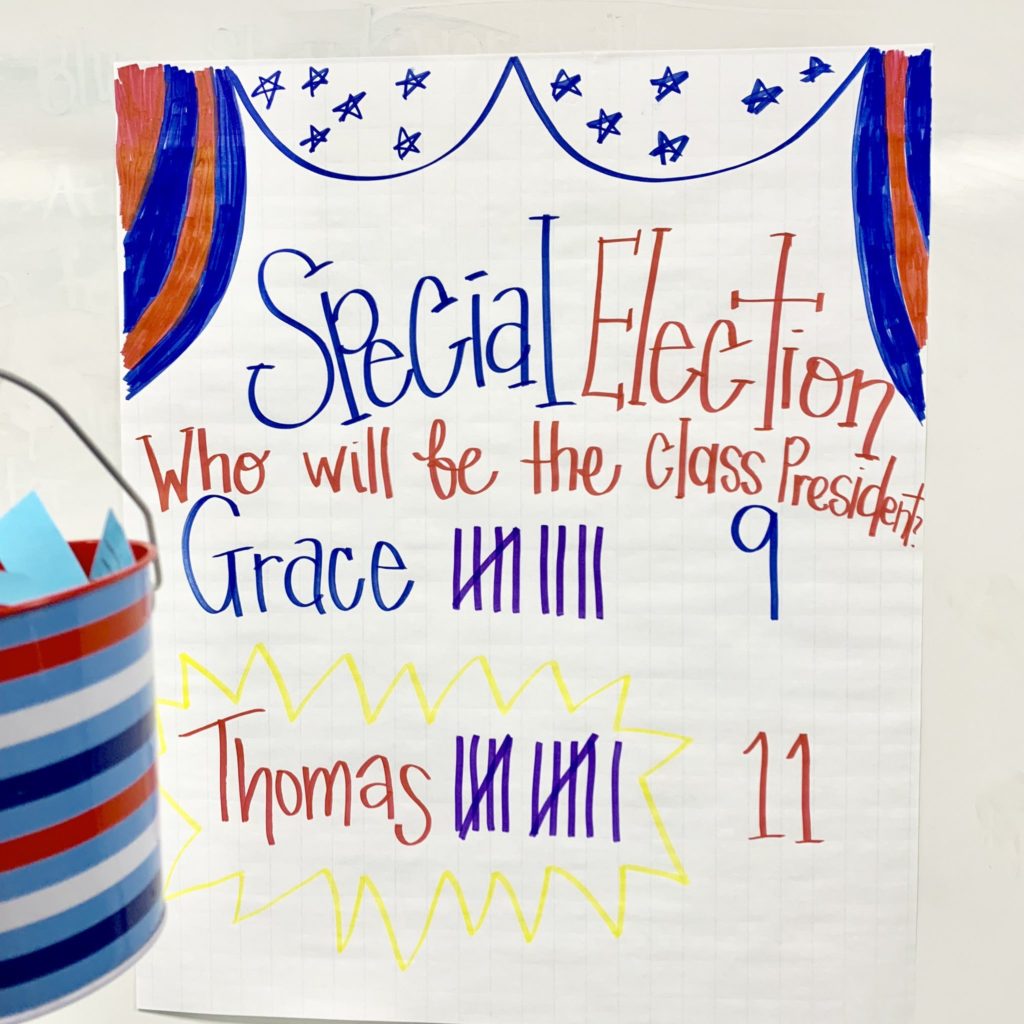
I love integrating reading and writing with math and do so as much as I can. One way to do this is that we read GRACE FOR PRESIDENT and then the kids voted before we read the ending together. I used the information collected to create a tally chart and then finished reading the story together!

3. Use Technology
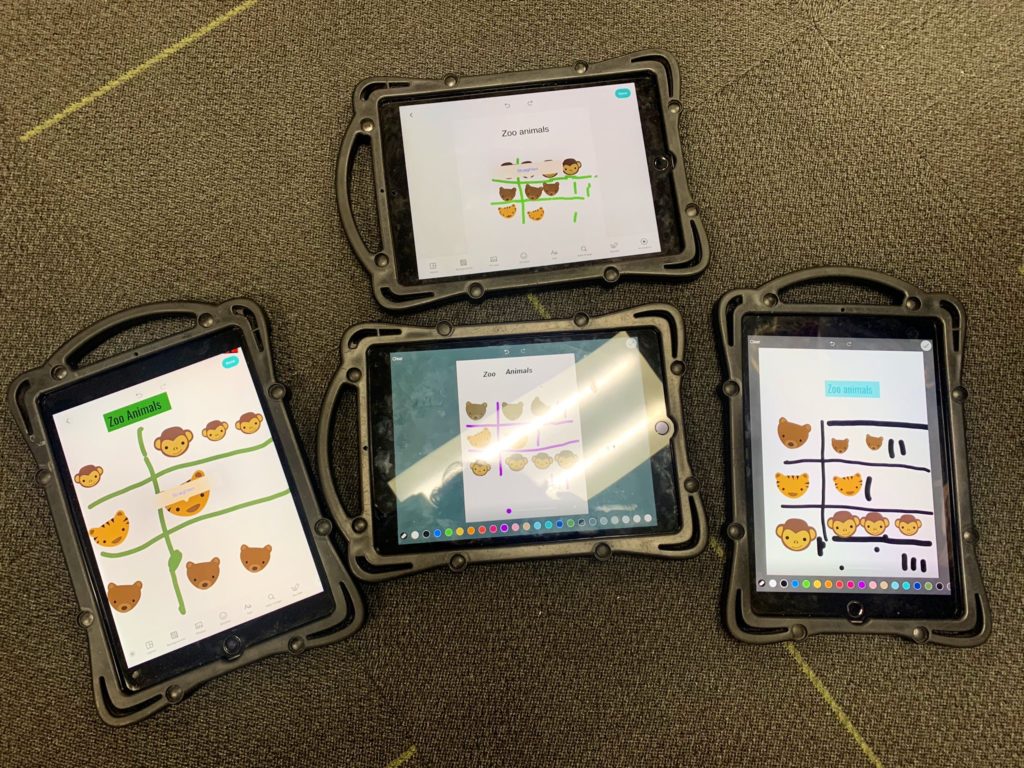
Technology can make learning about charts and graphs so fun and interactive! I use PicCollage to help my students create their own pictographs, and they absolutely love it!
If you need more resources on teaching charts and graphs, click on the images below to grab the Charts and Graphs packet with signs and CENTERS!